Tasks
Page contents:
List tasks as tree
This command provides a hierarchical tree view of reload tasks and external program tasks, similar to what is available in QlikView.
The tree view can be enhanced with colors (see this page) and task details.
There are quite a few customisation options available when creating a task tree.
Note that some options are used when creating task tables, these are not applicable for task trees. Ctrl-Q will show an error when invalid combinations of options are used.
Here Windows Terminal is used to run Ctrl-Q.
Let’s first take a look at the options for thetask-get command:
.\ctrl-q.exe task-get --help
Usage: ctrl-q task-get [options]

get info about one or more tasks

Options:
  --log-level <level>            log level (choices: "error", "warn", "info", "verbose", "debug", "silly", default: "info")
  --host <host>                  Qlik Sense server IP/FQDN
  --port <port>                  Qlik Sense repository service (QRS) port (usually 4242 for cert auth, 443 for jwt auth) (default: "4242")
  --schema-version <string>      Qlik Sense engine schema version (default: "12.612.0")
  --virtual-proxy <prefix>       Qlik Sense virtual proxy prefix (default: "")
  --secure <true|false>          https connection to Qlik Sense must use correct certificate. Invalid certificates will result in rejected/failed connection. (default: true)
  --auth-user-dir <directory>    user directory for user to connect with
  --auth-user-id <userid>        user ID for user to connect with
  -a, --auth-type <type>         authentication type (choices: "cert", "jwt", default: "cert")
  --auth-cert-file <file>        Qlik Sense certificate file (exported from QMC) (default: "./cert/client.pem")
  --auth-cert-key-file <file>    Qlik Sense certificate key file (exported from QMC) (default: "./cert/client_key.pem")
  --auth-root-cert-file <file>   Qlik Sense root certificate file (exported from QMC) (default: "./cert/root.pem")
  --auth-jwt <jwt>               JSON Web Token (JWT) to use for authentication with Qlik Sense server
  --task-type <type...>          type of tasks to include (choices: "reload", "ext-program")
  --task-id <ids...>             use task IDs to select which tasks to retrieve. Only allowed when --output-format=table
  --task-tag <tags...>           use tags to select which tasks to retrieve. Only allowed when --output-format=table
  --output-format <format>       output format (choices: "table", "tree", default: "tree")
  --output-dest <dest>           where to send task info (choices: "screen", "file", default: "screen")
  --output-file-name <name>      file name to store task info in (default: "")
  --output-file-format <format>  file type/format (choices: "excel", "csv", "json", default: "excel")
  --output-file-overwrite        overwrite output file without asking
  --text-color <show>            use colored text in task views (choices: "yes", "no", default: "yes")
  --tree-icons                   display task status icons in tree view
  --tree-details [detail...]     display details for each task in tree view (choices: "taskid", "laststart", "laststop", "nextstart", "appname", "appstream", default: "")
  --table-details [detail...]    which aspects of tasks should be included in table view. Not choosing any details will show all (choices: "common", "lastexecution", "tag", "customproperty", "schematrigger", "compositetrigger", default:
                                 "")
  -h, --help                     display help for command
Note:
Task trees are currently an all-or-nothing feature.
It is not possible to use the --task-id or --task-tag options when showing task trees.
Tree icons
If --tree-icons is used when starting Ctrl-Q emojis will be used to indicate the last known state for each task.
The used emojis are
| Descriptions | |
|---|---|
| ⏰ | Shown at the top of the tree of scheduled tasks. All tasks below this node have a time-based scheduled. |
| ✅ | Finished successfully. |
| ❌ | Failed |
| 🚫 | Skipped |
| 🛑 | Aborted |
| 💤 | Never started |
| ❔ | Unknown |
Text color
If --text-color yes is specified (yes is also the default value) colors will be used to make the created tree more readable.
--text-color no will create a plain-text tree (no colors).
Task tree details
The --tree-details option makes it possible to switch on/off individual task details. This can be useful to make the task tree easier to read.
The allowed values for this option are taskid, laststart, laststop, nextstart, appname, appstream.
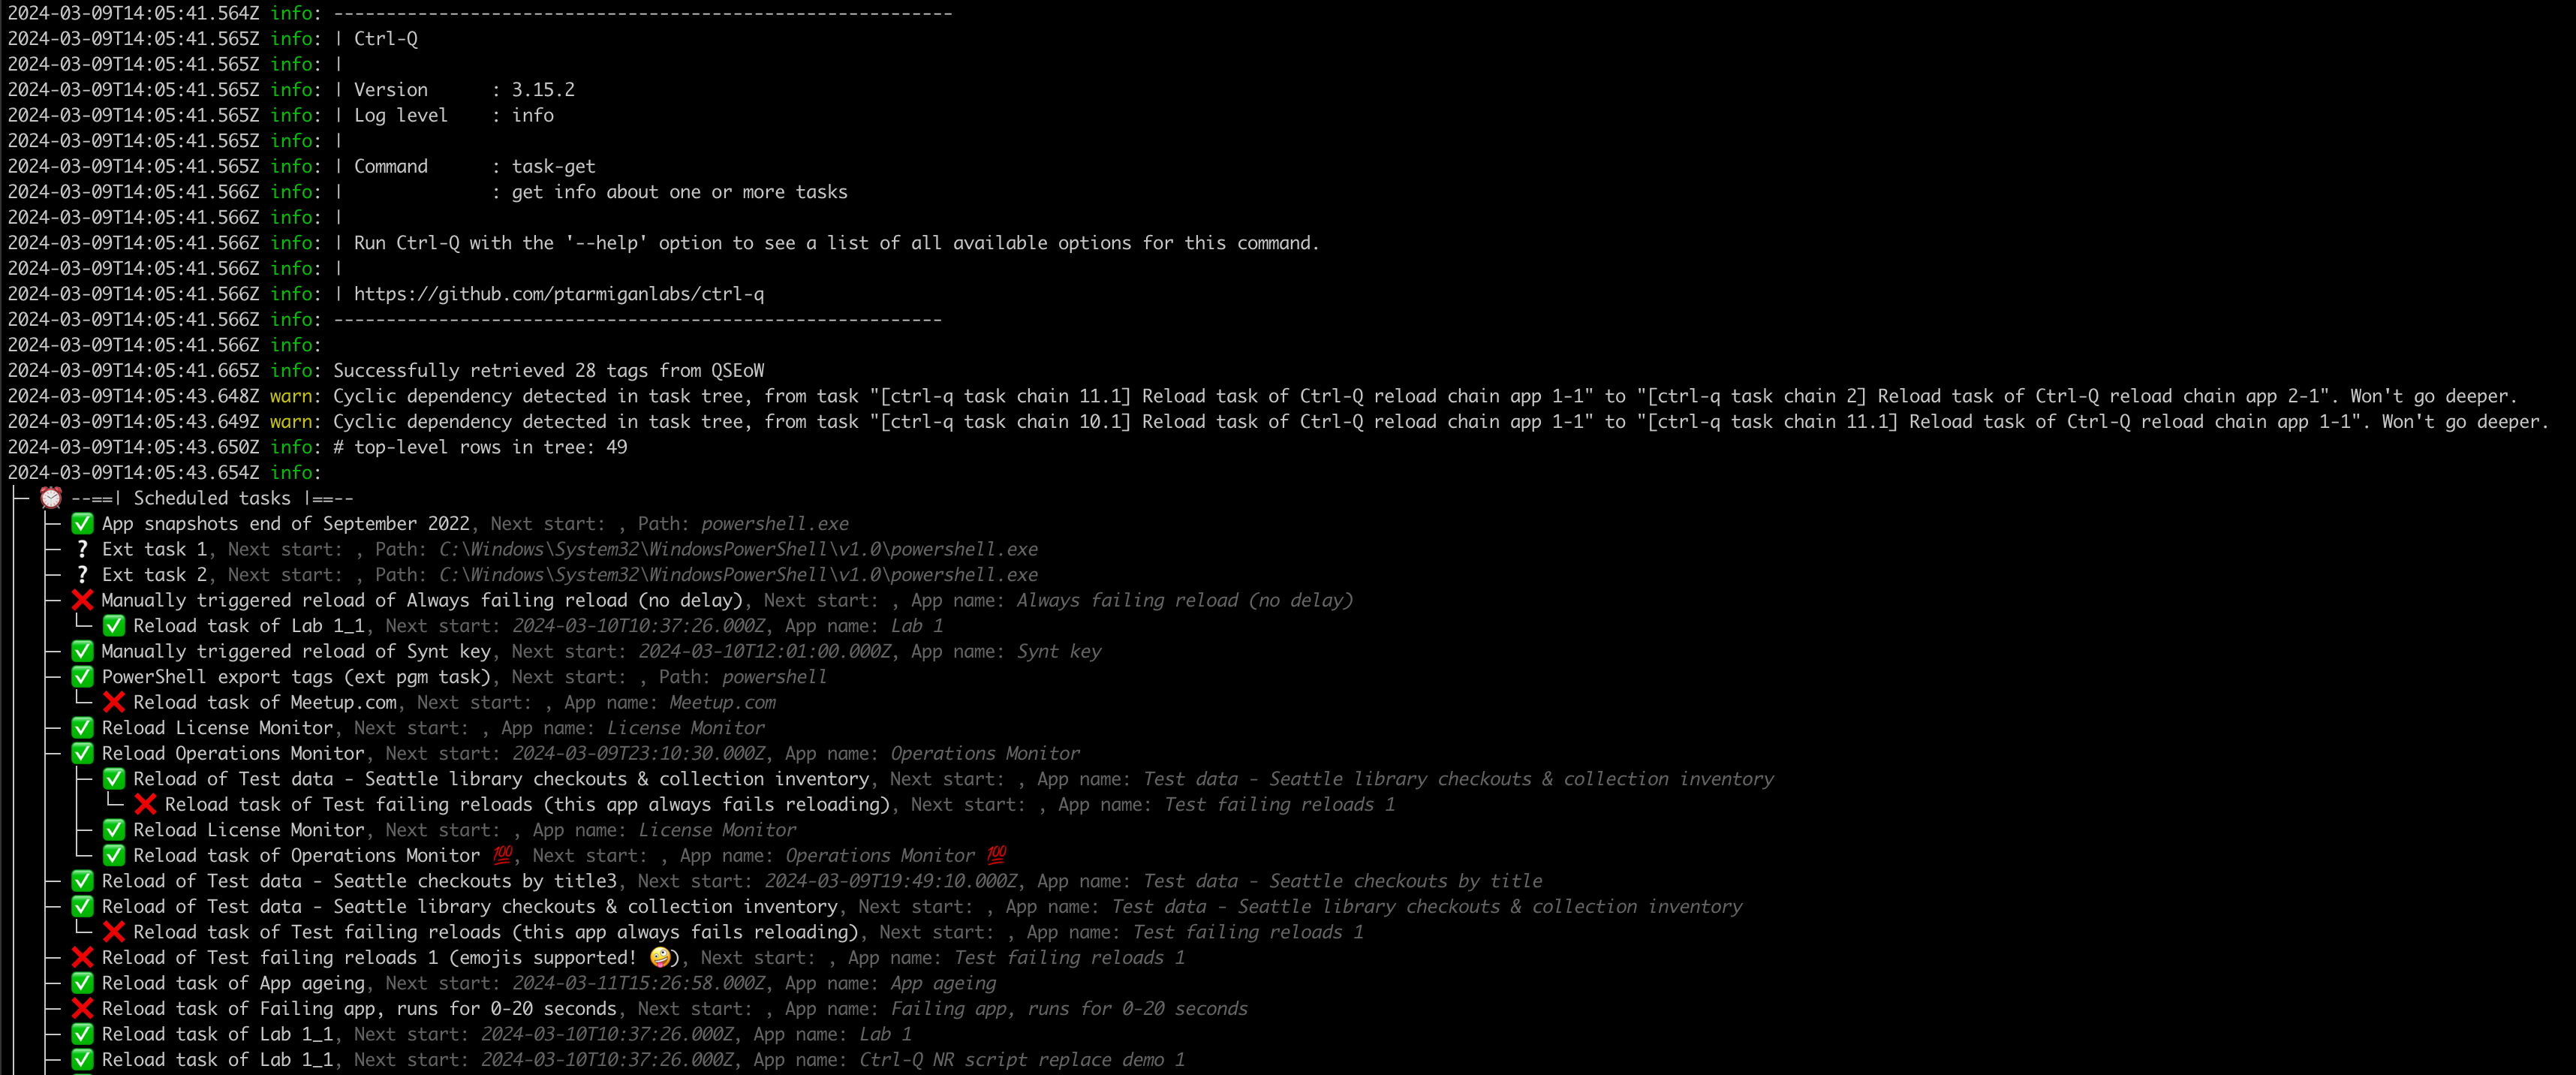
Let’s say we want a task tree with the app name and next start time for the task:
.\ctrl-q.exe task-get `
--auth-type cert `
--host pro2-win1.lab.ptarmiganlabs.net `
--auth-user-dir LAB `
--auth-user-id goran `
--output-format tree `
--output-dest screen `
--tree-icons `
--text-color yes `
--tree-details nextstart appname
Note how Ctrl-Q detects and warns about cyclic task dependencies:

Save tree to disk file
Under the hood the task tree is stored as a JSON structure.
It’s possible to save this JSON to disk:
.\ctrl-q.exe task-get `
--auth-type cert `
--host pro2-win1.lab.ptarmiganlabs.net `
--auth-user-dir LAB `
--auth-user-id goran `
--output-format tree `
--output-dest file `
--tree-details appname `
--output-file-name tasktree.json `
--output-file-format json
2024-03-12T08:41:11.115Z info: -----------------------------------------------------------
2024-03-12T08:41:11.115Z info: | Ctrl-Q
2024-03-12T08:41:11.115Z info: |
2024-03-12T08:41:11.115Z info: | Version      : 3.16.0
2024-03-12T08:41:11.115Z info: | Log level    : info
2024-03-12T08:41:11.115Z info: |
2024-03-12T08:41:11.115Z info: | Command      : task-get
2024-03-12T08:41:11.115Z info: |              : get info about one or more tasks
2024-03-12T08:41:11.115Z info: |
2024-03-12T08:41:11.115Z info: | Run Ctrl-Q with the '--help' option to see a list of all available options for this command.
2024-03-12T08:41:11.115Z info: |
2024-03-12T08:41:11.115Z info: | https://github.com/ptarmiganlabs/ctrl-q
2024-03-12T08:41:11.115Z info: ----------------------------------------------------------
2024-03-12T08:41:11.115Z info:
2024-03-12T08:41:11.286Z info: Successfully retrieved 28 tags from QSEoW
2024-03-12T08:41:13.114Z warn: Cyclic dependency detected in task tree, from task "[ctrl-q task chain 11.1] Reload task of Ctrl-Q reload chain app 1-1" to "[ctrl-q task chain 2] Reload task of Ctrl-Q reload chain app 2-1". Won't go deeper.
2024-03-12T08:41:13.114Z warn: Cyclic dependency detected in task tree, from task "[ctrl-q task chain 10.1] Reload task of Ctrl-Q reload chain app 1-1" to "[ctrl-q task chain 11.1] Reload task of Ctrl-Q reload chain app 1-1". Won't go deeper.
2024-03-12T08:41:13.130Z info: ✅ Writing task tree to disk file "tasktree.json".
Running the same command again, when the destination file already exists, results in a question to overwrite the file:
2024-03-12T08:41:32.882Z info: -----------------------------------------------------------
2024-03-12T08:41:32.882Z info: | Ctrl-Q
2024-03-12T08:41:32.882Z info: |
2024-03-12T08:41:32.882Z info: | Version      : 3.16.0
2024-03-12T08:41:32.882Z info: | Log level    : info
2024-03-12T08:41:32.882Z info: |
2024-03-12T08:41:32.882Z info: | Command      : task-get
2024-03-12T08:41:32.882Z info: |              : get info about one or more tasks
2024-03-12T08:41:32.897Z info: |
2024-03-12T08:41:32.897Z info: | Run Ctrl-Q with the '--help' option to see a list of all available options for this command.
2024-03-12T08:41:32.897Z info: |
2024-03-12T08:41:32.897Z info: | https://github.com/ptarmiganlabs/ctrl-q
2024-03-12T08:41:32.897Z info: ----------------------------------------------------------
2024-03-12T08:41:32.897Z info:
2024-03-12T08:41:33.023Z info: Successfully retrieved 28 tags from QSEoW
2024-03-12T08:41:34.898Z warn: Cyclic dependency detected in task tree, from task "[ctrl-q task chain 11.1] Reload task of Ctrl-Q reload chain app 1-1" to "[ctrl-q task chain 2] Reload task of Ctrl-Q reload chain app 2-1". Won't go deeper.
2024-03-12T08:41:34.898Z warn: Cyclic dependency detected in task tree, from task "[ctrl-q task chain 10.1] Reload task of Ctrl-Q reload chain app 1-1" to "[ctrl-q task chain 11.1] Reload task of Ctrl-Q reload chain app 1-1". Won't go deeper.
2024-03-12T08:41:34.898Z info:
                                  Destination file "tasktree.json" exists. Do you want to overwrite it? (y/n) y
2024-03-12T08:41:35.694Z info:
2024-03-12T08:41:35.694Z info: ✅ Writing task tree to disk file "tasktree.json".
To forcibly overwrite the destination file the --output-file-overwrite option can be specified.
List tasks as table
This command provides a tabular view of tasks.
Tags, custom properties, schedules, triggers and references to other tasks are all included in the table.
This tabular task view can be shown on screen or saved to disk as Excel or CSV files.
The idea is that all information needed to recreate the tasks should be included in the table.
In reality a few more fields are included, for example app name for the app associated with a task.
The table view can be enhanced with colours (see this page) and task details.
There are quite a few customisation options available when creating a task tree.
Note that some options are used when creating task tables, these are not applicable for task trees. Ctrl-Q will show an error when invalid combinations of options are used.
Show task table on screen
Show a list of tasks on screen, including main task fields as well as any tags defined for the tasks.
.\ctrl-q.exe task-get `
--auth-type cert `
--host pro2-win1.lab.ptarmiganlabs.net `
--auth-user-dir LAB `
--auth-user-id goran `
--output-format table `
--output-dest screen `
--task-type reload ext-program `
--table-details common tag
Note:
It’s possible to get more information about tasks by adding additional values to the --table-details option.
Run .\ctrl-q.exe task-get --help to show a complete list of all options and their allowed values.
If --table-details is not specified all available information will be showed about the tasks.
This will result in a very wide table!
2024-03-12T08:42:10.554Z info: -----------------------------------------------------------
2024-03-12T08:42:10.554Z info: | Ctrl-Q
2024-03-12T08:42:10.554Z info: |
2024-03-12T08:42:10.554Z info: | Version      : 3.16.0
2024-03-12T08:42:10.554Z info: | Log level    : info
2024-03-12T08:42:10.554Z info: |
2024-03-12T08:42:10.554Z info: | Command      : task-get
2024-03-12T08:42:10.569Z info: |              : get info about one or more tasks
2024-03-12T08:42:10.569Z info: |
2024-03-12T08:42:10.569Z info: | Run Ctrl-Q with the '--help' option to see a list of all available options for this command.
2024-03-12T08:42:10.569Z info: |
2024-03-12T08:42:10.569Z info: | https://github.com/ptarmiganlabs/ctrl-q
2024-03-12T08:42:10.569Z info: ----------------------------------------------------------
2024-03-12T08:42:10.569Z info:
2024-03-12T08:42:10.710Z info: Successfully retrieved 28 tags from QSEoW
2024-03-12T08:42:12.540Z info: # rows in table: 90
2024-03-12T08:42:12.540Z info: # reload tasks in table: 76
2024-03-12T08:42:12.540Z info: # external program tasks in table: 14
2024-03-12T08:42:12.680Z info:
┌──────────────────────────────────────────────────────────────────────────────────────────────────────────────────────────────────────────────────────────────────────────────────────────────────────────────────────────────────────────────────────────────────────────────────────────────────────────────────────────────────────────────────────────────────────────────────────────────────────────────────────────────────────────────────────────────────────────────────┐
│ # reload tasks: 68, # external program tasks: 8, # rows in table: 76

                                                                         │
├──────────────┬──────────────────┬──────────────────────────────────────────────────────────────────────────┬──────────────────────────────────────┬──────────────┬──────────────┬──────────────┬──────────────────────────────────────┬────────────────┬────────────────────┬───────────────────────────────────────────────────────────┬─────────────────────────────────────────────────────────────────────────────┬──────────────────────────────────────────────────────────┤
│ Task counter │ Task type        │ Task name                                                                │ Task id                              │ Task enabled │ Task timeout │ Task retries │ App id                               │ Partial reload │ Manually triggered │ Ext program path                                          │ Ext program parameters
              │ Tags                                                     │
├──────────────┼──────────────────┼──────────────────────────────────────────────────────────────────────────┼──────────────────────────────────────┼──────────────┼──────────────┼──────────────┼──────────────────────────────────────┼────────────────┼────────────────────┼───────────────────────────────────────────────────────────┼─────────────────────────────────────────────────────────────────────────────┼──────────────────────────────────────────────────────────┤
│ 1            │ External program │ App snapshots end of September 2022                                      │ c5cc047d-e520-4ccb-b88f-ac4f9d49d4be │ true         │ 60           │ 1            │                                      │                │                    │ powershell.exe                                            │ -File \\pro2-win1\c$\tools\script\qs_archive_apps_to_stream_end_of_sept.ps1 │                                                          │
├──────────────┼──────────────────┼──────────────────────────────────────────────────────────────────────────┼──────────────────────────────────────┼──────────────┼──────────────┼──────────────┼──────────────────────────────────────┼────────────────┼────────────────────┼───────────────────────────────────────────────────────────┼─────────────────────────────────────────────────────────────────────────────┼──────────────────────────────────────────────────────────┤
│ 2            │ External program │ Ext program task chaining 1                                              │ 4ce41cf3-bc6a-4f66-ad00-ffdeb9a7e468 │ true         │ 15           │ 0            │                                      │                │                    │ powershell.exe                                            │ -File \\pro2-win1\c$\tools\script\ext_task_1.ps1
              │                                                          │
├──────────────┼──────────────────┼──────────────────────────────────────────────────────────────────────────┼──────────────────────────────────────┼──────────────┼──────────────┼──────────────┼──────────────────────────────────────┼────────────────┼────────────────────┼───────────────────────────────────────────────────────────┼─────────────────────────────────────────────────────────────────────────────┼──────────────────────────────────────────────────────────┤
│ 3            │ External program │ Node-RED ext program task demo 1                                         │ d6bfc66a-393b-4eea-8ecd-1b1629c91683 │ true         │ 30           │ 0            │                                      │                │                    │ powershell.exe                                            │
              │ Ctrl-Q demo                                              │
├──────────────┼──────────────────┼──────────────────────────────────────────────────────────────────────────┼──────────────────────────────────────┼──────────────┼──────────────┼──────────────┼──────────────────────────────────────┼────────────────┼────────────────────┼───────────────────────────────────────────────────────────┼─────────────────────────────────────────────────────────────────────────────┼──────────────────────────────────────────────────────────┤
│ 4            │ External program │ PowerShell export data connections                                       │ e7b8d484-5297-4caf-a727-38200905171e │ true         │ 15           │ 1            │                                      │                │                    │ powershell                                                │ -File \\pro2-win1\c$\tools\script\qs_export_data_connections.ps1            │                                                          │
├──────────────┼──────────────────┼──────────────────────────────────────────────────────────────────────────┼──────────────────────────────────────┼──────────────┼──────────────┼──────────────┼──────────────────────────────────────┼────────────────┼────────────────────┼───────────────────────────────────────────────────────────┼─────────────────────────────────────────────────────────────────────────────┼──────────────────────────────────────────────────────────┤
│ 5            │ External program │ PowerShell export tags (ext pgm task)                                    │ 1d5dc4c1-8bd3-455a-9e6a-873da103a950 │ true         │ 15           │ 0            │                                      │                │                    │ powershell                                                │ -File \\pro2-win1\c$\tools\script\qs_export_tags_cps.ps1                    │                                                          │
├──────────────┼──────────────────┼──────────────────────────────────────────────────────────────────────────┼──────────────────────────────────────┼──────────────┼──────────────┼──────────────┼──────────────────────────────────────┼────────────────┼────────────────────┼───────────────────────────────────────────────────────────┼─────────────────────────────────────────────────────────────────────────────┼──────────────────────────────────────────────────────────┤
│ 6            │ External program │ Sample external task                                                     │ 7d4617cd-a9d5-433a-8c82-742e58bfb38b │ true         │ 1440         │ 0            │                                      │                │                    │ C:\Windows\System32\WindowsPowerShell\v1.0\powershell.exe │ -File \\pro2-win1\c$\tools\script\ext_task_1.ps1
              │                                                          │
├──────────────┼──────────────────┼──────────────────────────────────────────────────────────────────────────┼──────────────────────────────────────┼──────────────┼──────────────┼──────────────┼──────────────────────────────────────┼────────────────┼────────────────────┼───────────────────────────────────────────────────────────┼─────────────────────────────────────────────────────────────────────────────┼──────────────────────────────────────────────────────────┤
...
...
The --task-id and --task-tag options take a list of task IDs and tags, respectively.
When used only the tasks matching the specified task IDs and tags will be included in the created table.
These options can be used both when showing the task table on screen and when storing it on disk.
Example command using these options. Note the double quotes around the task tags:
.\ctrl-q.exe task-get `
--auth-type cert `
--host pro2-win1.lab.ptarmiganlabs.net `
--auth-user-dir LAB `
--auth-user-id goran `
--output-format table `
--output-dest screen `
--table-details common tag `
--task-id e3b27f50-b1c0-4879-88fc-c7cdd9c1cf3e 09b3c78f-04dd-45e3-a4bf-1b074d6572fa `
--task-tag "Demo apps" "Finance" "Sales forecast"
Save task to disk file in tabular format
Saving a task table to disk file (Excel and CSV file formats supported) is done via the task-get command, adding --output-format table, --output-dest file, --output-file-format csv and --output-file-name <filename> options.
Here the most common task fileds together with task tags are included in the table written to a CSV file:
.\ctrl-q.exe task-get `
--auth-type cert `
--host pro2-win1.lab.ptarmiganlabs.net `
--auth-user-dir LAB `
--auth-user-id goran `
--output-format table `
--output-dest file `
--table-details common tag `
--output-file-format csv `
--output-file-name tasktable.csv
2024-03-12T08:43:16.986Z info: -----------------------------------------------------------
2024-03-12T08:43:16.986Z info: | Ctrl-Q
2024-03-12T08:43:16.986Z info: |
2024-03-12T08:43:16.986Z info: | Version      : 3.16.0
2024-03-12T08:43:16.986Z info: | Log level    : info
2024-03-12T08:43:16.986Z info: |
2024-03-12T08:43:16.986Z info: | Command      : task-get
2024-03-12T08:43:16.986Z info: |              : get info about one or more tasks
2024-03-12T08:43:16.986Z info: |
2024-03-12T08:43:16.986Z info: | Run Ctrl-Q with the '--help' option to see a list of all available options for this command.
2024-03-12T08:43:16.986Z info: |
2024-03-12T08:43:16.986Z info: | https://github.com/ptarmiganlabs/ctrl-q
2024-03-12T08:43:16.986Z info: ----------------------------------------------------------
2024-03-12T08:43:16.986Z info:
2024-03-12T08:43:17.124Z info: Successfully retrieved 28 tags from QSEoW
2024-03-12T08:43:18.969Z info: ✅ Writing task table to disk file "tasktable.csv".
Save task to disk file as JSON
If task defintions should be read by some other system the task definitions can be saved as JSON.
Here only the most basic task info included via the --table-details option.
.\ctrl-q.exe task-get `
--auth-type cert `
--host pro2-win1.lab.ptarmiganlabs.net `
--auth-user-dir LAB `
--auth-user-id goran `
--output-format table `
--output-dest file `
--table-details common `
--output-file-format json `
--output-file-name tasks.json
2024-03-12T08:43:53.762Z info: -----------------------------------------------------------
2024-03-12T08:43:53.762Z info: | Ctrl-Q
2024-03-12T08:43:53.762Z info: |
2024-03-12T08:43:53.762Z info: | Version      : 3.16.0
2024-03-12T08:43:53.762Z info: | Log level    : info
2024-03-12T08:43:53.762Z info: |
2024-03-12T08:43:53.762Z info: | Command      : task-get
2024-03-12T08:43:53.762Z info: |              : get info about one or more tasks
2024-03-12T08:43:53.762Z info: |
2024-03-12T08:43:53.762Z info: | Run Ctrl-Q with the '--help' option to see a list of all available options for this command.
2024-03-12T08:43:53.762Z info: |
2024-03-12T08:43:53.762Z info: | https://github.com/ptarmiganlabs/ctrl-q
2024-03-12T08:43:53.762Z info: ----------------------------------------------------------
2024-03-12T08:43:53.762Z info:
2024-03-12T08:43:53.903Z info: Successfully retrieved 28 tags from QSEoW
2024-03-12T08:43:55.747Z info: ✅ Writing task table to disk file "tasks.json".
The resulting JSON file looks like this:
[
    [
        "Task counter",
        "Task type",
        "Task name",
        "Task id",
        "Task enabled",
        "Task timeout",
        "Task retries",
        "App id",
        "Partial reload",
        "Manually triggered"
    ],
    [
        1,
        "Reload",
        "Manually triggered reload of Always failing reload (no delay)",
        "0d815a99-1ca3-4131-a398-6878bd735fd8",
        true,
        1440,
        0,
        "deba4bcf-47e4-472e-97b2-4fe8d6498e11",
        false,
        true
    ],
    [
        2,
        "Reload",
        "Manually triggered reload of App1 🏆",
        "b37f8034-faee-4e9b-bbca-5aba0cdf5df2",
        true,
        1440,
        0,
        "26634113-9163-44e4-a879-d87817d6e887",
        false,
        true
    ],
...
...
]
List tasks as network graph
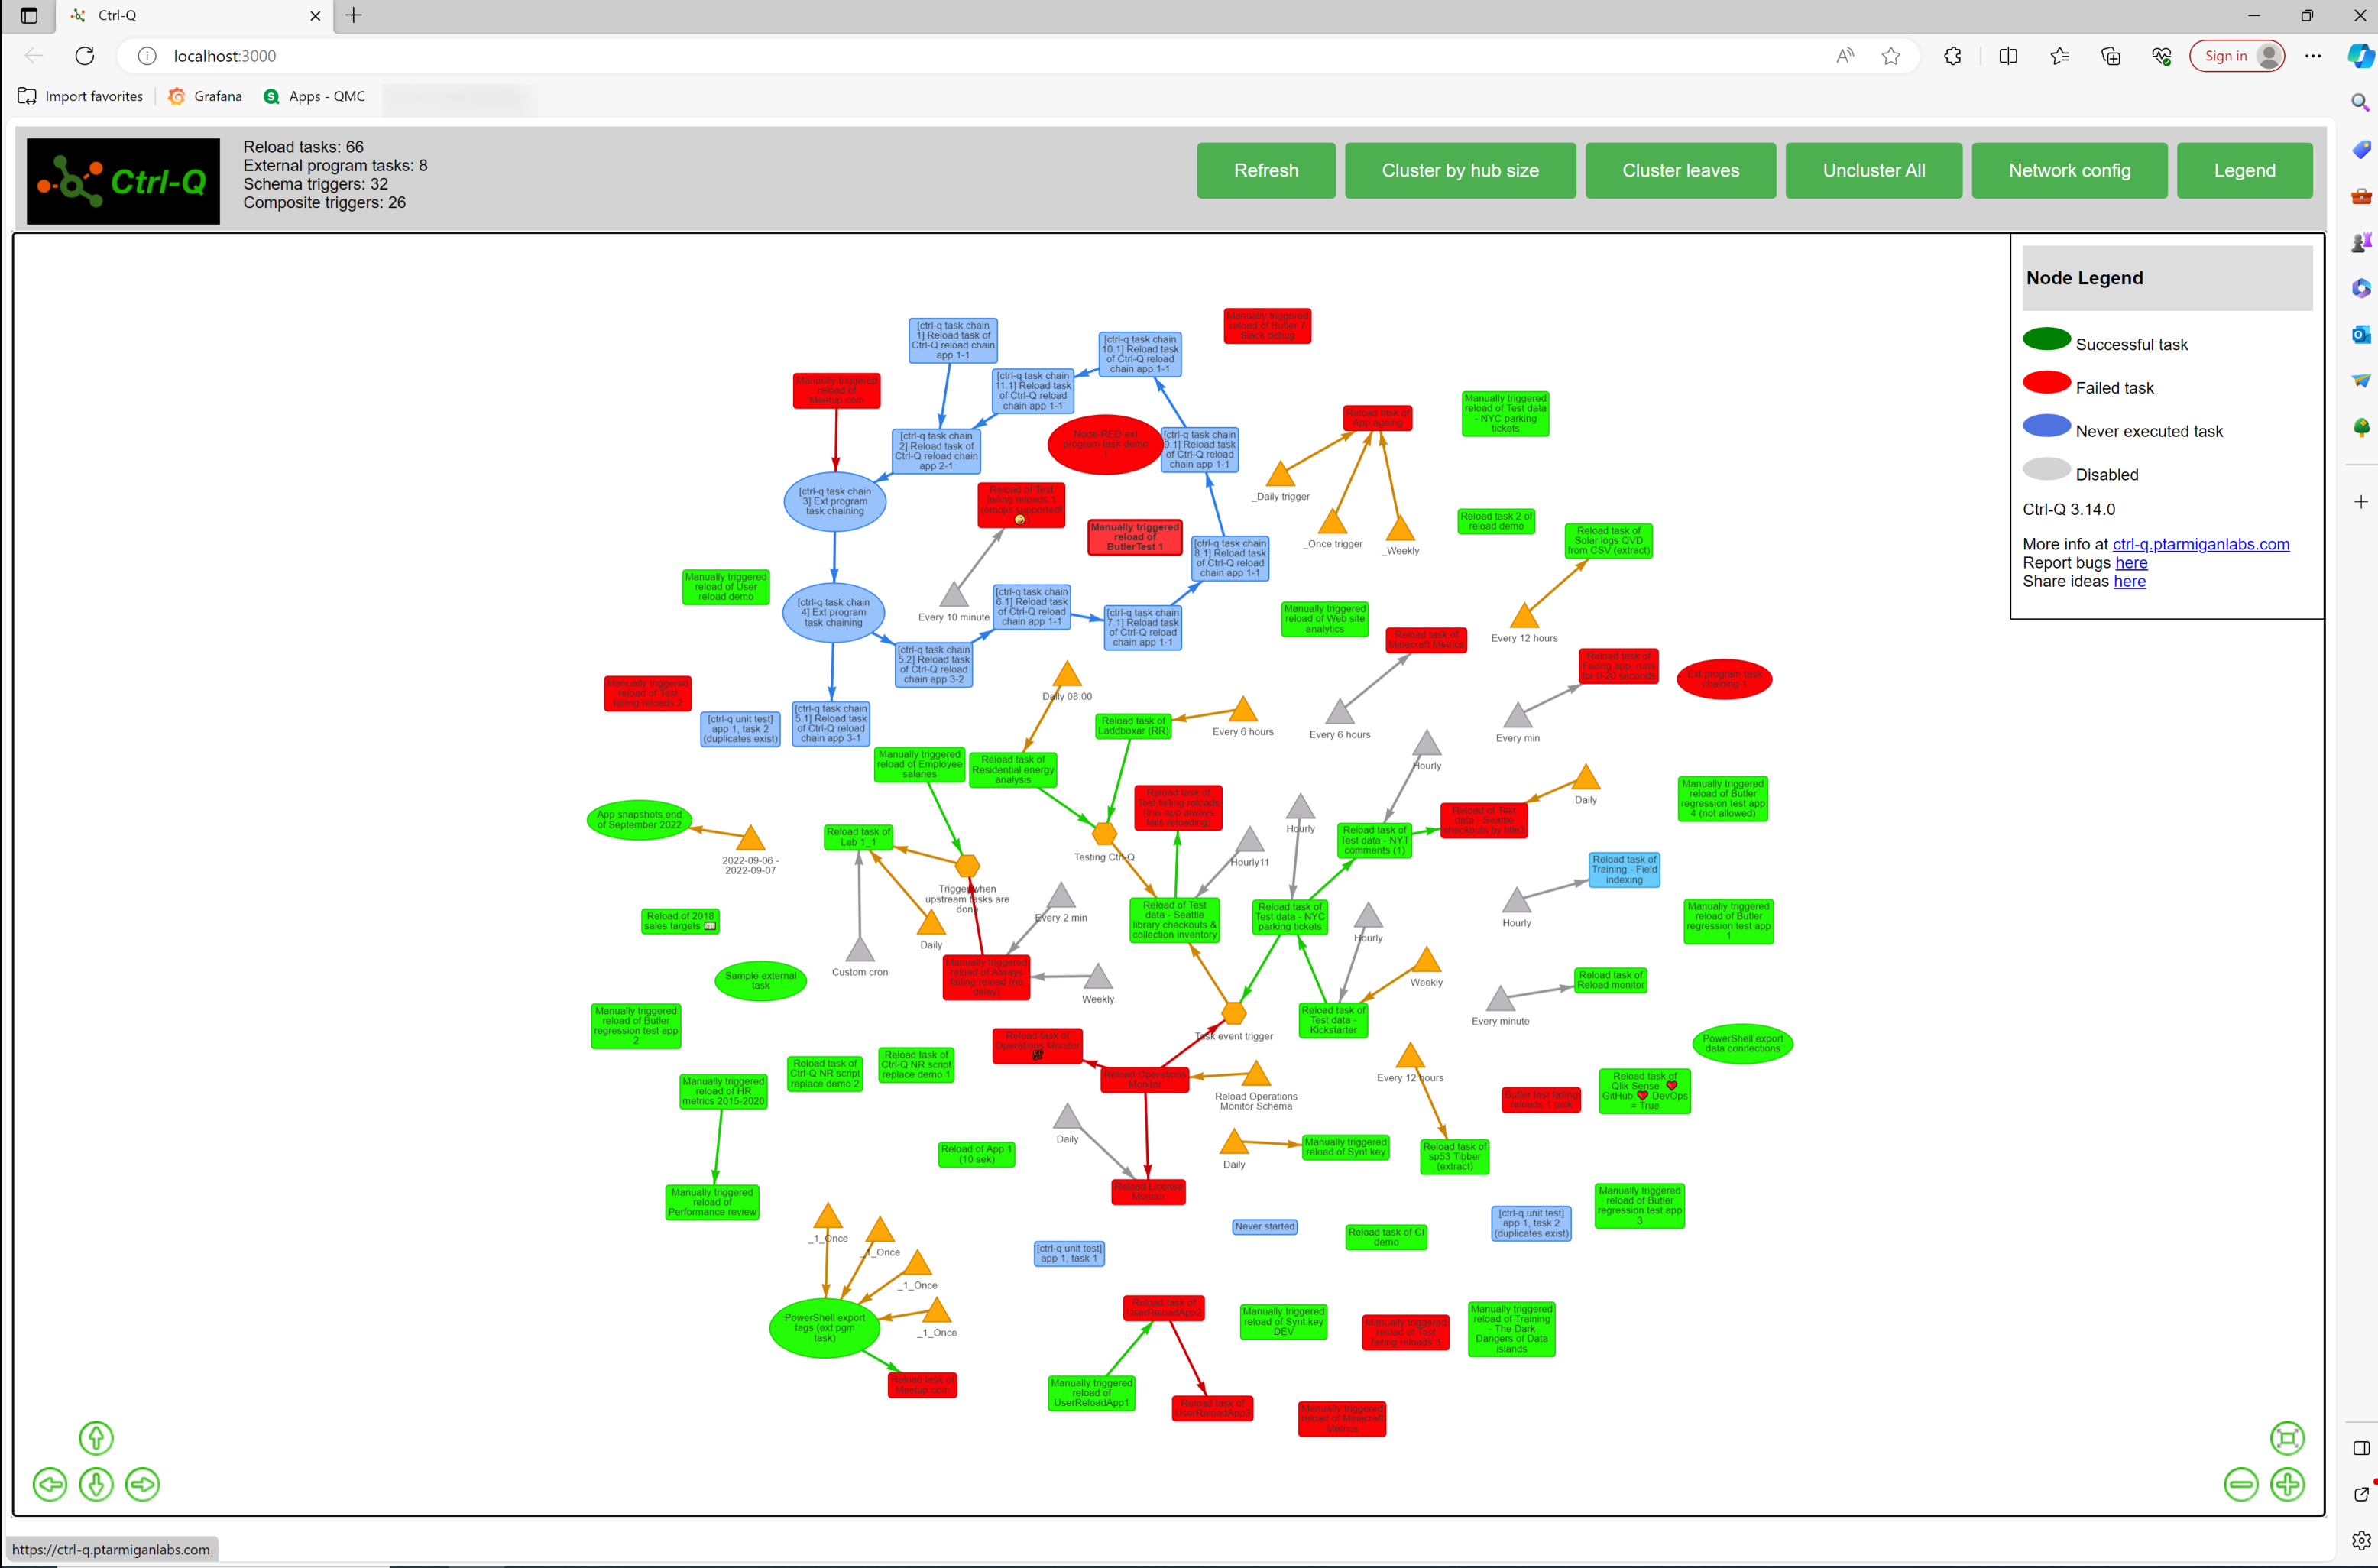
This command provides an interactive network graph view of reload tasks and external program tasks.
First Ctrl-Q will retrieve information about all reload and external program tasks from the Qlik Sense repository service (QRS).
This includes information about last execution results for the tasks.
A web server is then started on the local computer where Ctrl-Q is running, serving a web page with the network graph in it.
A link to the web page is shown in the console where Ctrl-Q is running.
In the example below the link is http://localhost:3000.
Beta feature
Graph visualisation of Qlik Sense tasks is a beta feature.
Only a basic set of features are available at this point.
Performance is ok for small to medium sized Qlik Sense sites, but will slower for larger sites (many hundreds or thousands of tasks).
On Windows using PowerShell it can look like this:
PS C:\tools\ctrl-q> .\ctrl-q.exe task-vis --host pro2-win1.lab.ptarmiganlabs.net --auth-type cert --auth-user-dir LAB --auth-user-id goran
2024-03-12T08:44:24.637Z info: -----------------------------------------------------------
2024-03-12T08:44:24.637Z info: | Ctrl-Q
2024-03-12T08:44:24.637Z info: |
2024-03-12T08:44:24.637Z info: | Version      : 3.16.0
2024-03-12T08:44:24.637Z info: | Log level    : info
2024-03-12T08:44:24.637Z info: |
2024-03-12T08:44:24.637Z info: | Command      : task-vis
2024-03-12T08:44:24.637Z info: |              : visualise task network
2024-03-12T08:44:24.637Z info: |
2024-03-12T08:44:24.637Z info: | Run Ctrl-Q with the '--help' option to see a list of all available options for this command.
2024-03-12T08:44:24.637Z info: |
2024-03-12T08:44:24.637Z info: | https://github.com/ptarmiganlabs/ctrl-q
2024-03-12T08:44:24.637Z info: ----------------------------------------------------------
2024-03-12T08:44:24.637Z info:
2024-03-12T08:44:26.684Z info: Using vis.js to visualize tasks, more info at https://github.com/visjs/vis-network
2024-03-12T08:44:26.684Z info:
2024-03-12T08:44:26.684Z info: Task visualization server listening on http://localhost:3000
2024-03-12T08:44:26.684Z info: Press Ctrl-C to quit.
Ctrl-clicking (on Windows. Use Cmd-Clik on macOS) on the link will open the network graph in a browser:

Node types
| Node type | Shape | Description |
|---|---|---|
| Schema trigger | Triangle | A schema trigger is a time-based task trigger. Orange if enabled, gray when disabled |
| Composite trigger | Hexagon | If a task’s composite trigger has two or more upstream triggers the composite trigger will be shown as a hexagon. Orange if enabled, gray when disabled. If the composite trigger only has one upstream task the composite trigger will not be shown in the graph. In this case the arrow from the upstream task will go directly to the downstream task. |
| Reload task | Rectangle | A reload task. Green when last reload finished successfully, red when last reload failed, gray when task is disabled, blue when task has never been started. |
| External program task | Elipse | An external program task. Green when last run finished successfully, red when last run failed, gray when task is disabled, blue when task has never been started. |
User interface
The user interface consists of a toolbar at the top of the page and the network graph itself.
The toolbar has a fixed position and size at the top of the page, while the network graph will resize to fit the available space below the toolbar.
Collapsing/expanding node clusters
Networks with many tasks can be hard to read.
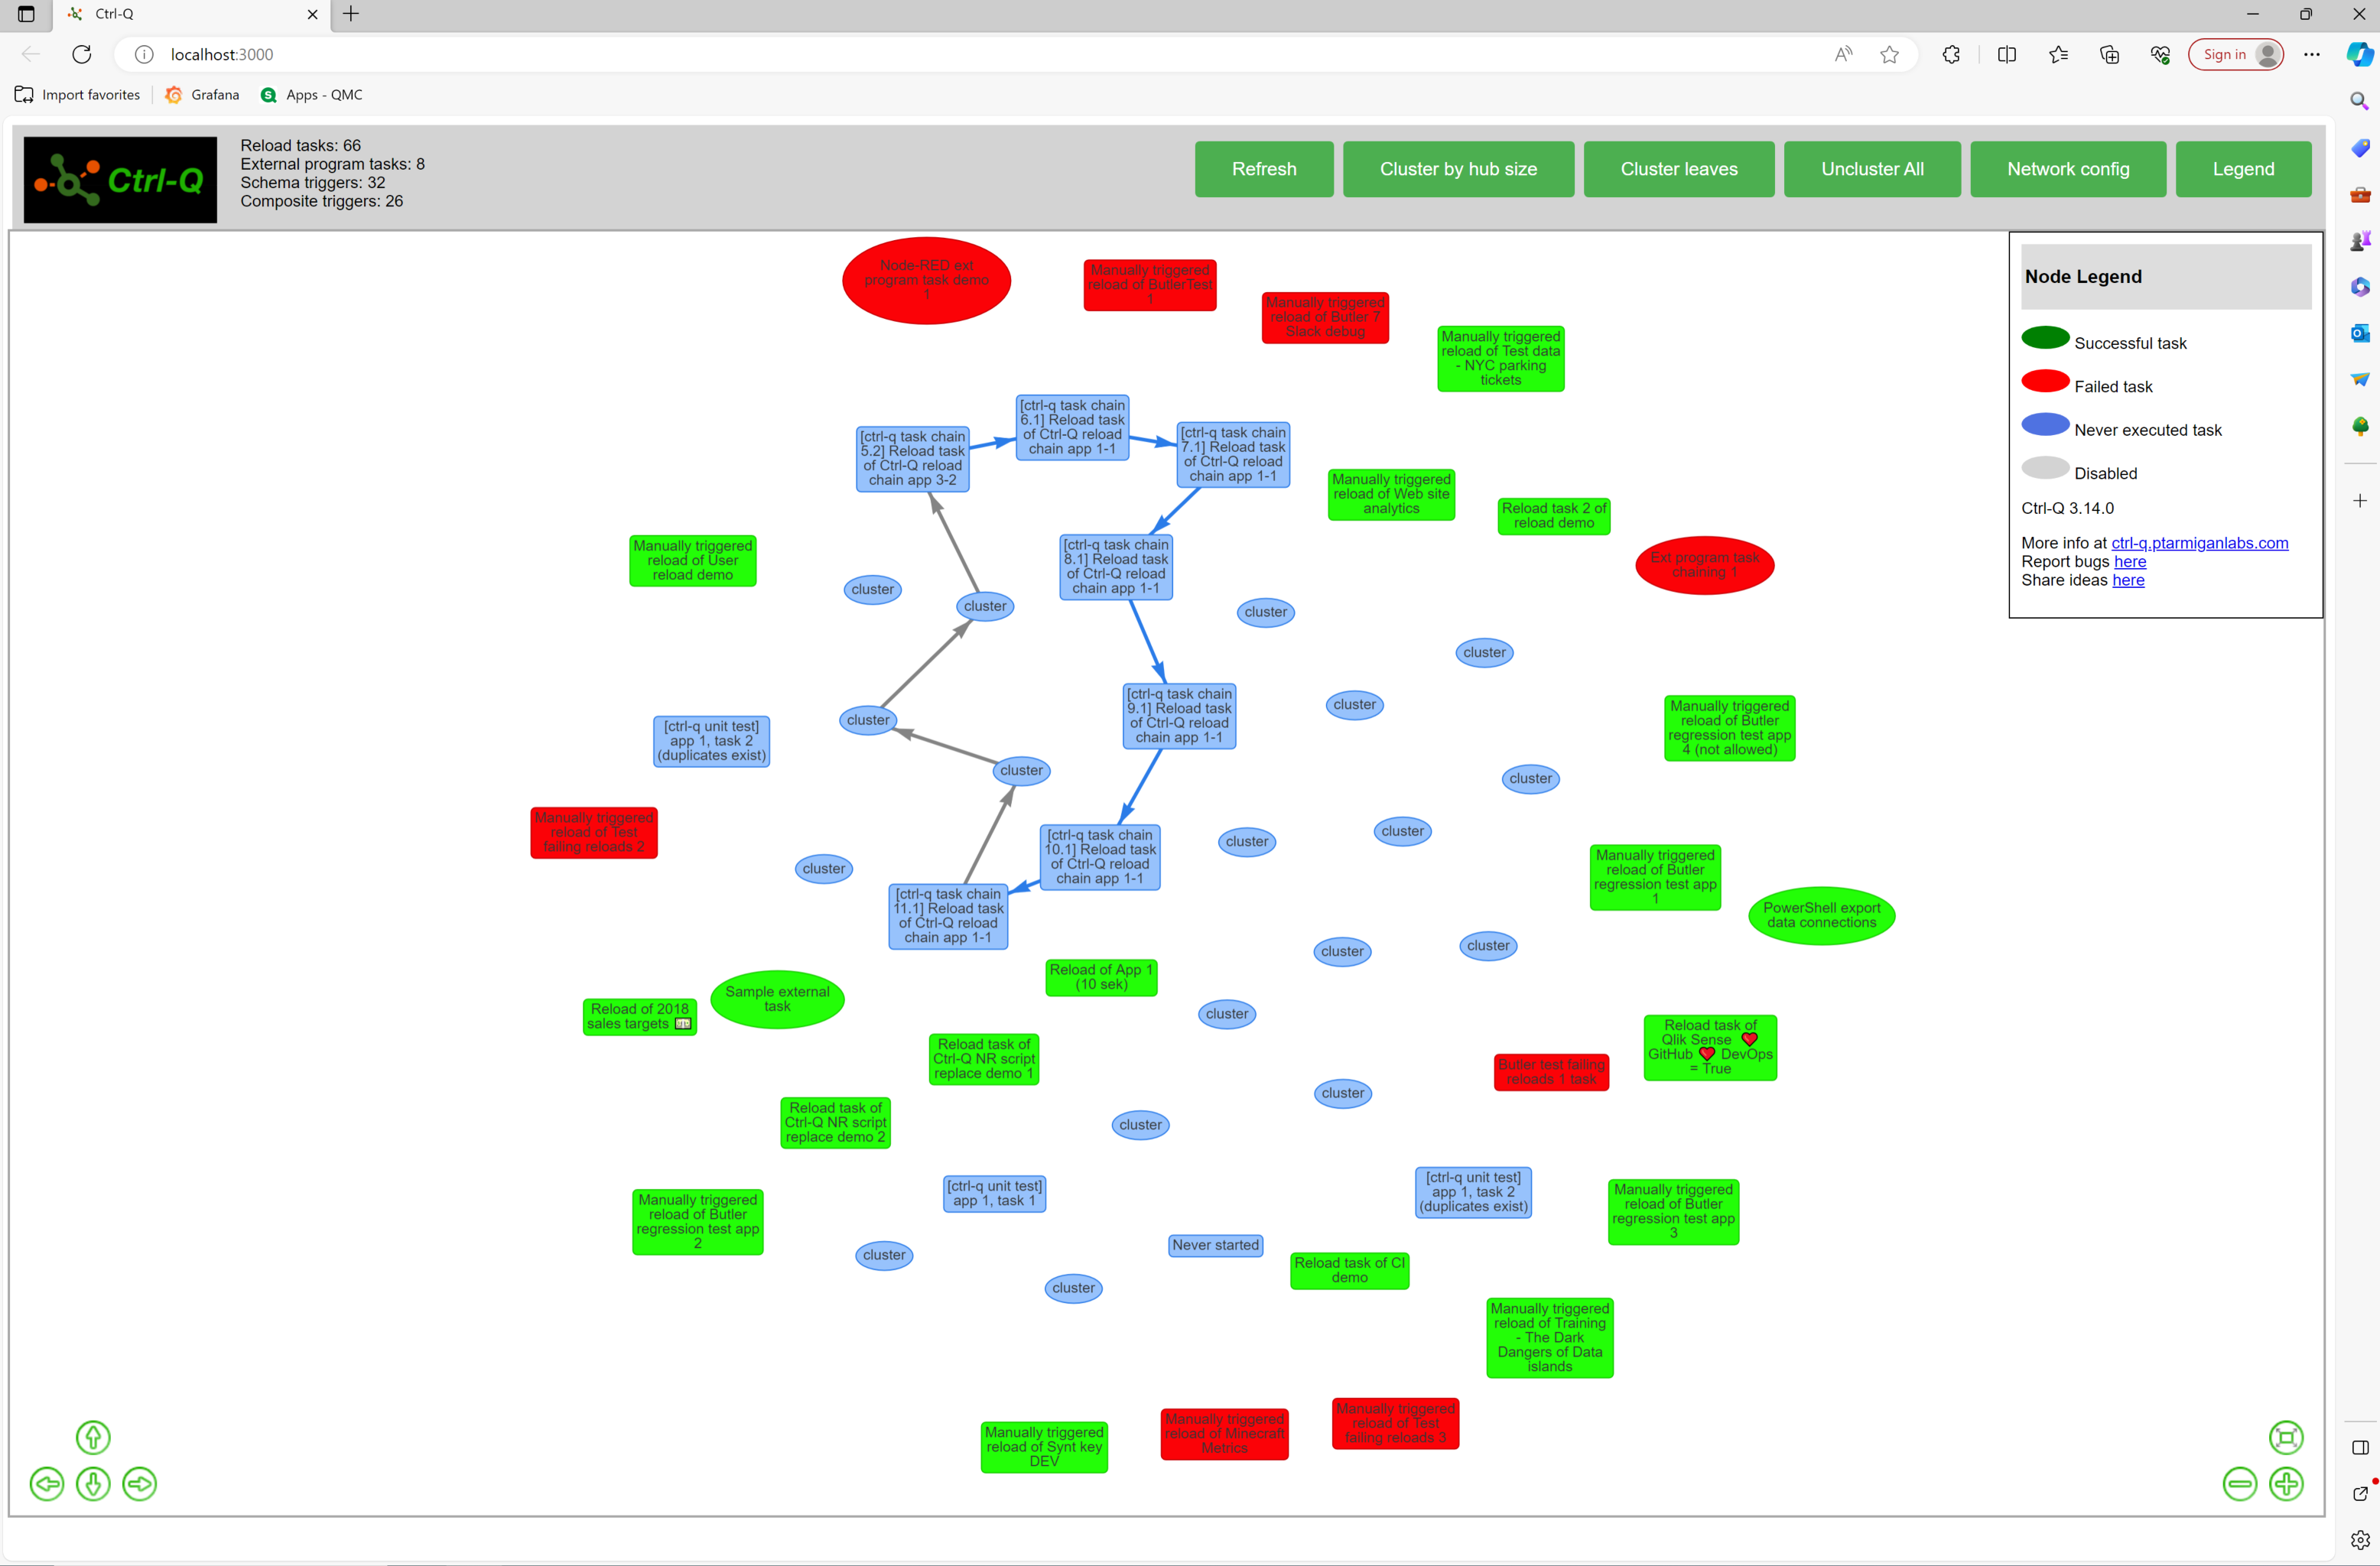
To make it easier to read such networks Ctrl-Q offers the possibility to collapse/expand node clusters and/or leaf nodes.
- A node cluster is a group of nodes that are connected to each other.
- A leaf node is a node that does not have any downstream nodes.
Here is an example where the “Cluster leaves” button has been clicked a few times.
Note the circular task chain that becomes very easy to see when the leaf nodes are collapsed:

Expanding the leaf nodes again makes is done by clicking the “Uncluster all” button.
Legend and network graph configuration
The “Legend” button will toggle the floating (also moveable!) legend window on/off.
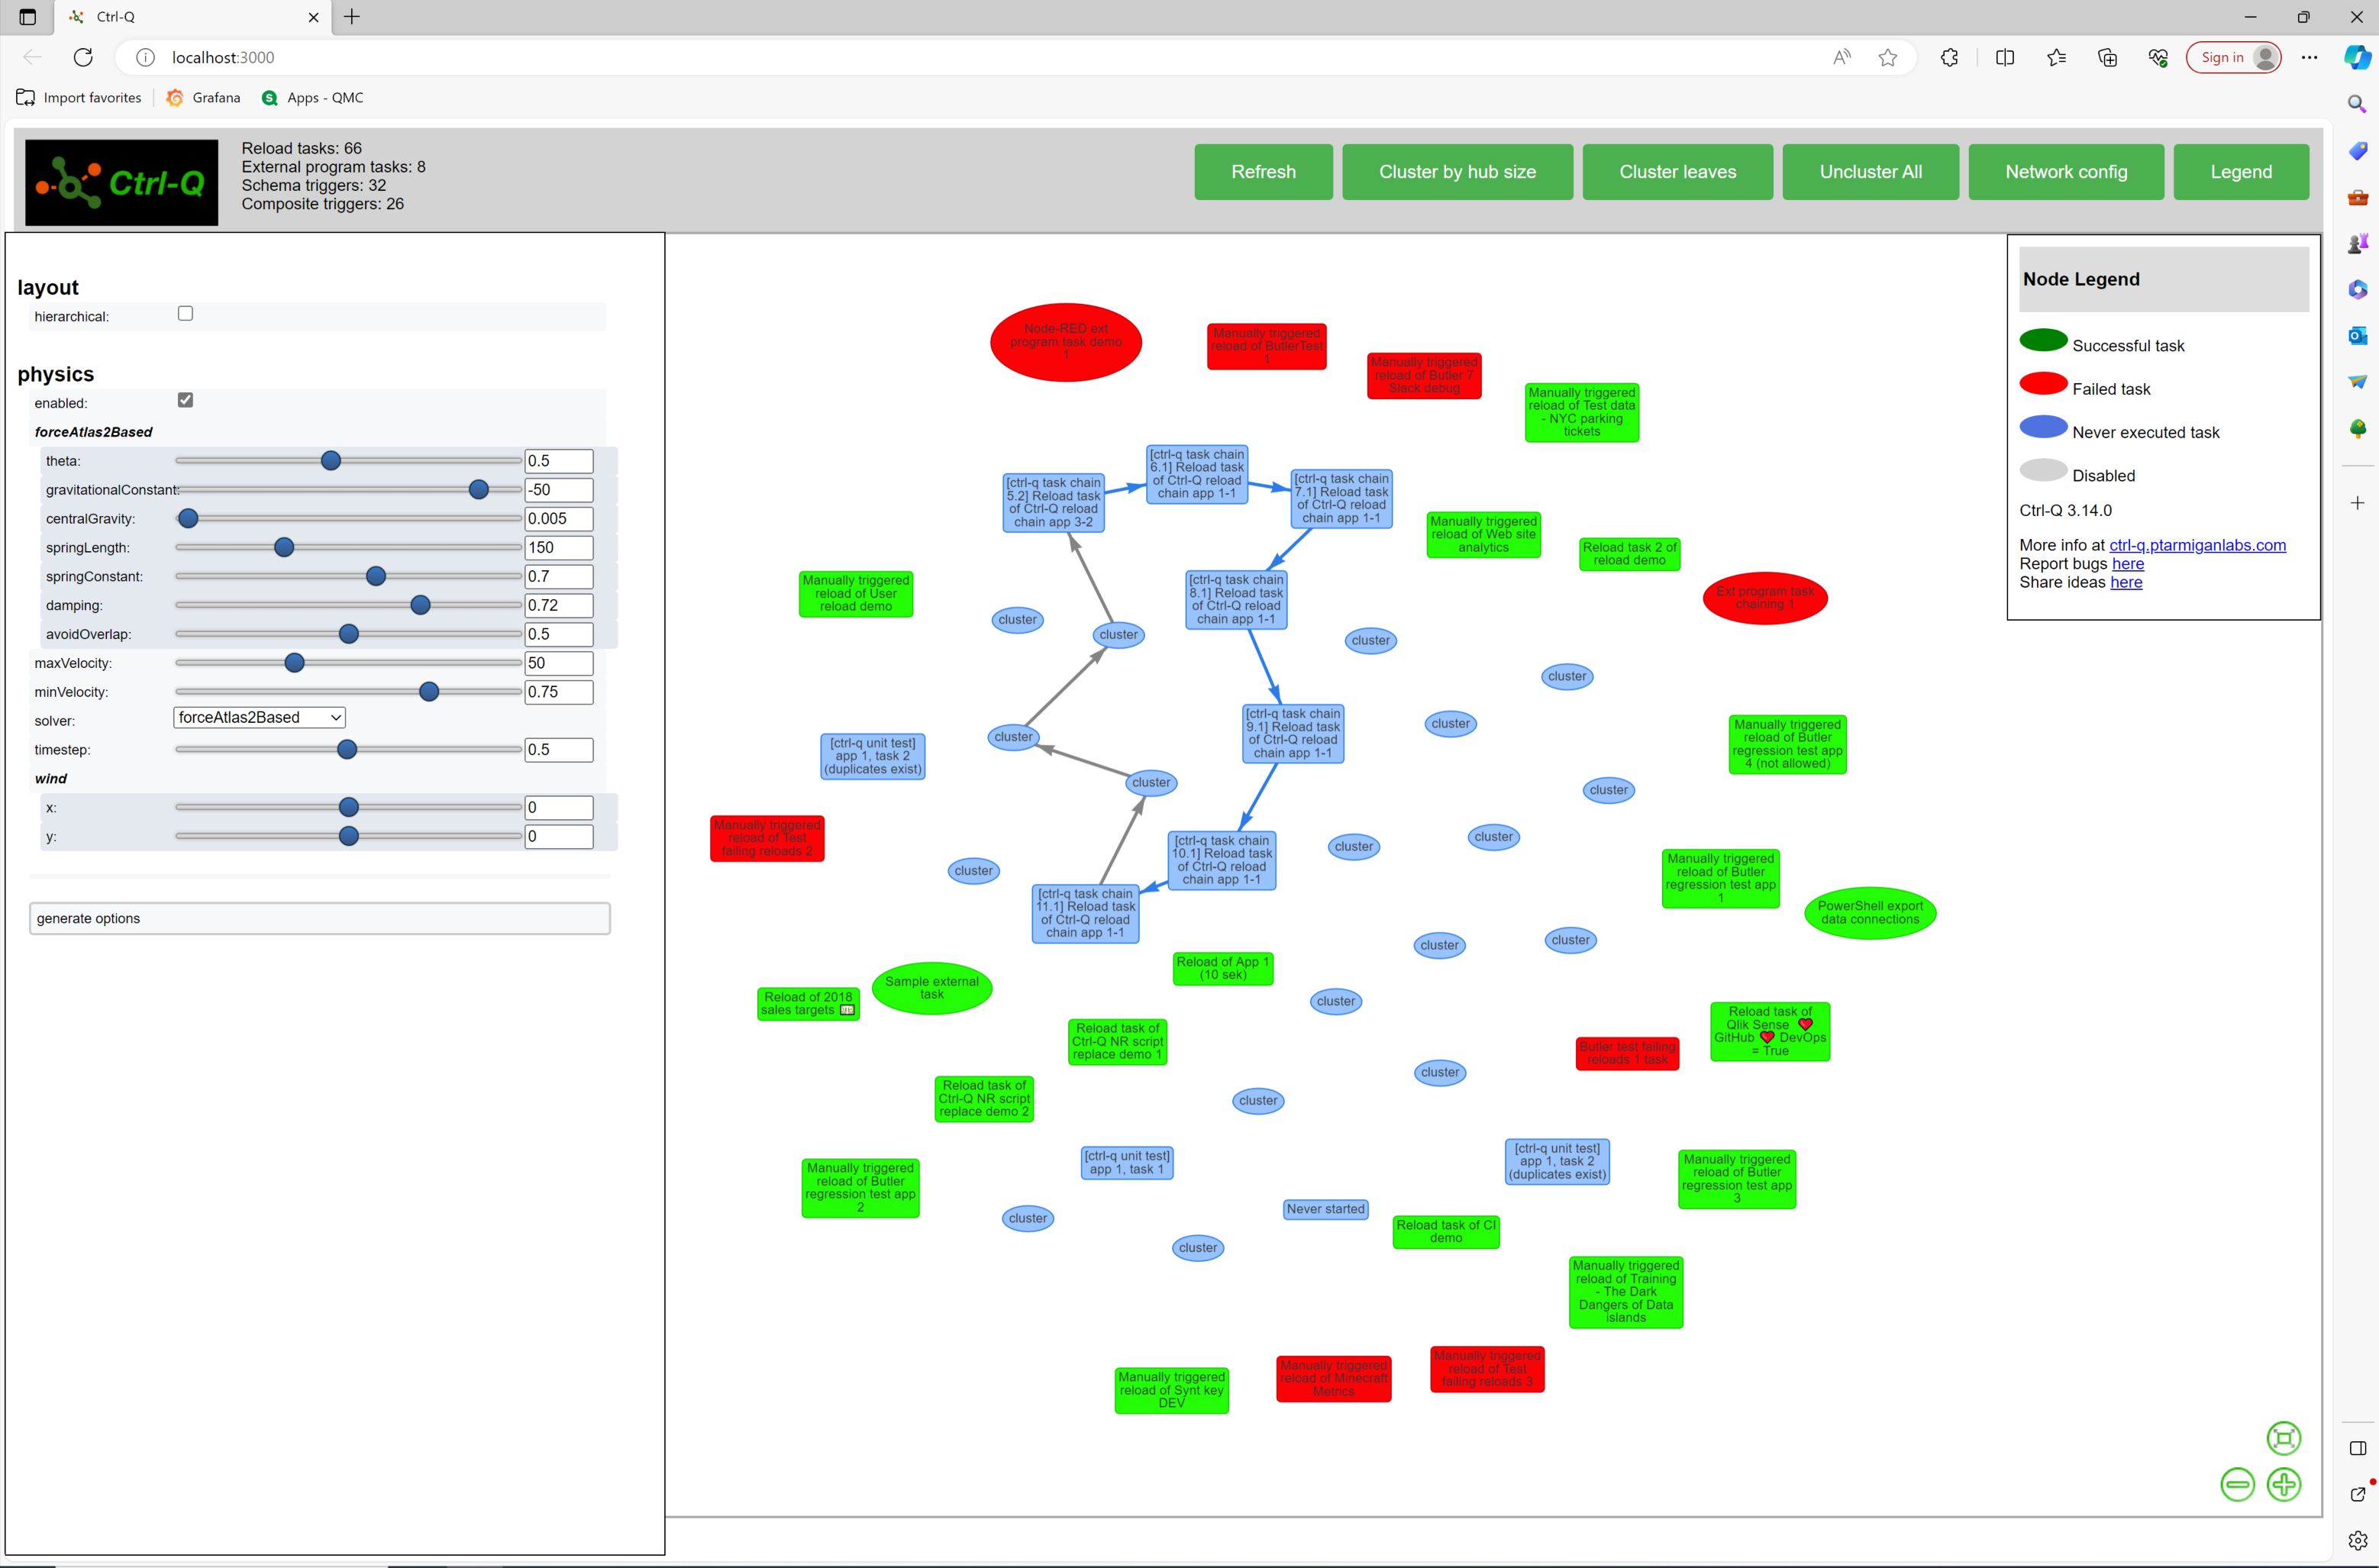
The “Network config” button will toggle a network configuration pane to the left on/off:

The network configuration pane makes it possible to fine-tune the parameters used when creating the network graph.
Things like gravity, spring stiffness, overlap stragegy etc. can be adjusted.
If the network graph is hard to read it can be worth trying different values for these parameters.
Tip
If things don’t work out as expected the “Refresh” button in the top toolbar will reload tasks from Qlik Sense and reset all visualisation parameters to their default values.Feedback
Was this page helpful?